Unilever Plc Company Profile
Unilever Plc
Consumer goods
- Establishment Year
1929
- Headquarters
The UK
- Key Management
Mr. Alan Jope (CEO)
- Revenue (US$ Mn)
~ 54,962.4 (2021)
- Headcount
~ 1,48,000 (2021)
- Website
Business Description
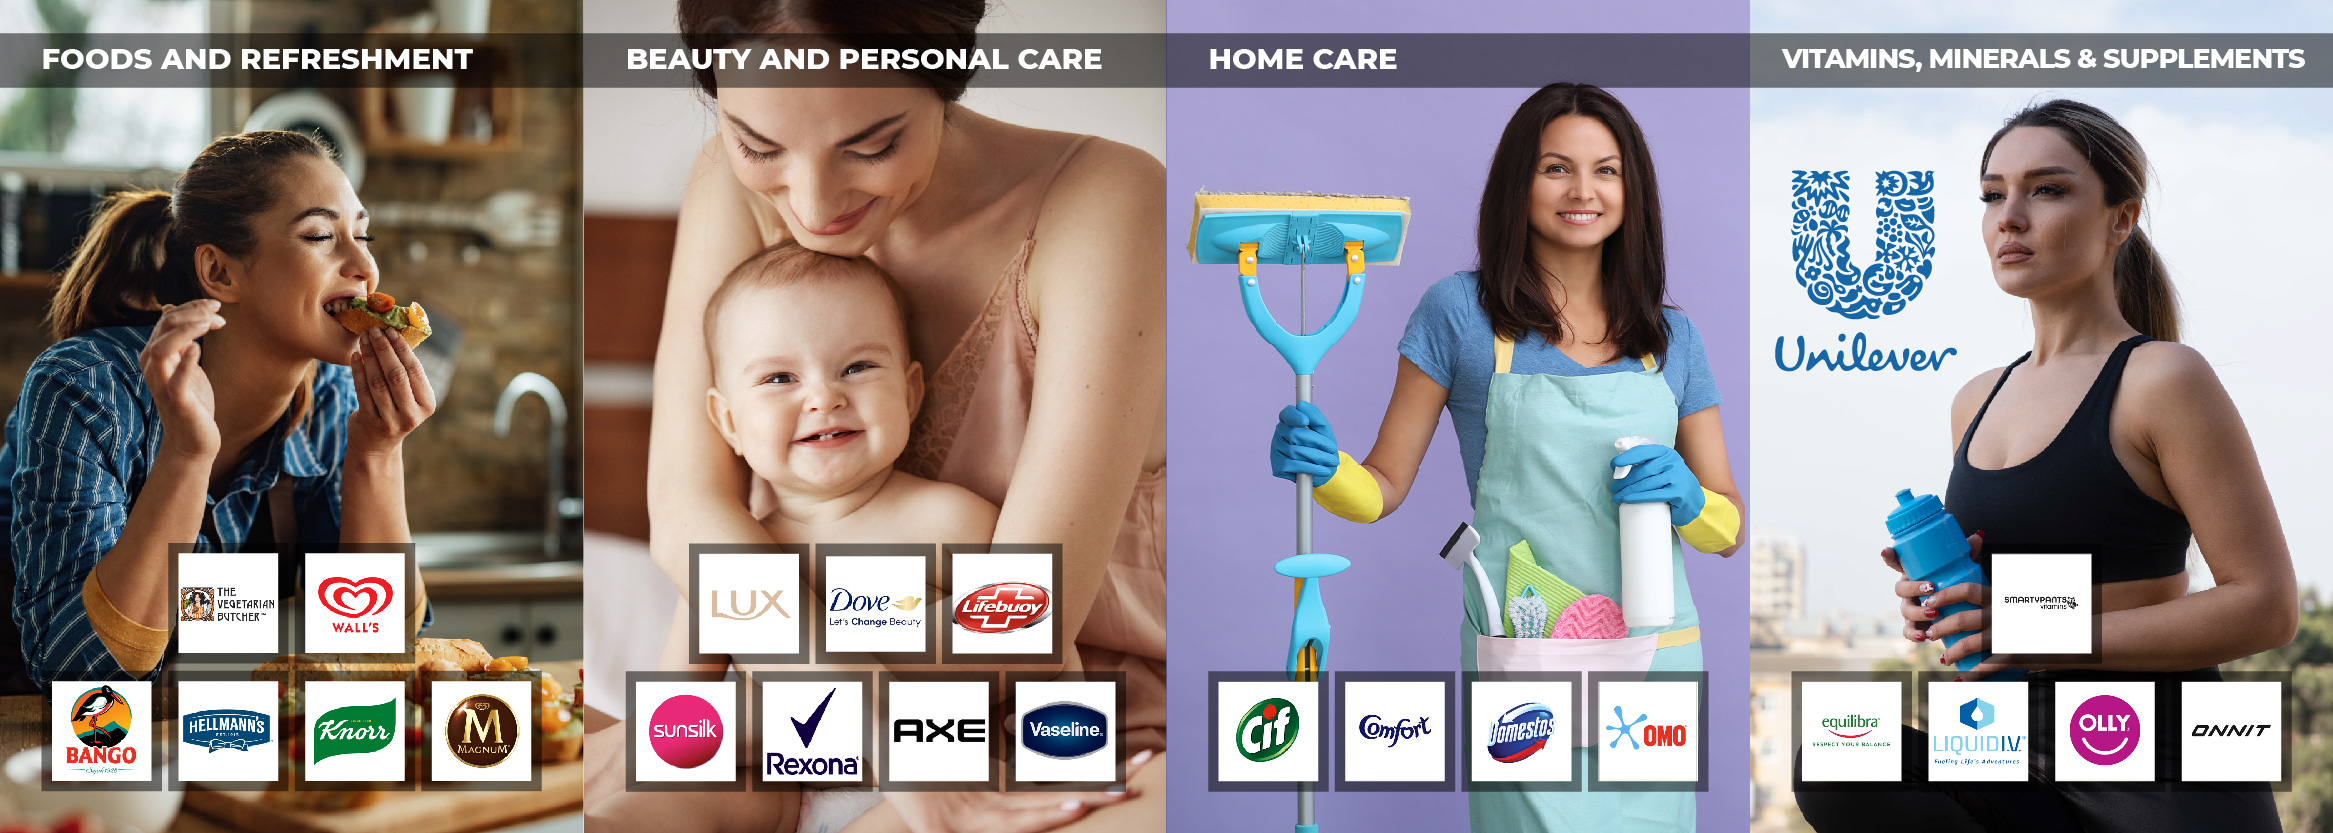
Unilever Plc engages in the production and sales of consumer products. Antonius Johannes Jurgens founded the company on January 1, 1930. Samuel van den Bergh also co-founded it. The headquarters of the company is located in London, United Kingdom. It operates in three segments: Beauty and Personal care; Home Care; and food and refreshments.
Beauty and Personal Care sells skin care products such as deodorants, skin care products, and skin cleansing. The Home Care section includes a wide range of cleaning products as well as a fabric category. Foods and Refreshments sell ice creams and savory as well as dressings and tea.
Key Financials
Revenue (US$ Mn)
- Unilever Plc’s annual revenue for 2021 was US$ 54,962 Mn, a 3.35% increase from 2020
- From 2019’s annual revenues, Unilever Plc registered a -8.64% decrease in 2020, amounting to US$ 53,179 Mn
- Total revenue of US$ 58,210 Mn was generated in 2019 by Unilever Plc.
Operating Income(US$ Mn)
- The operating income generated by Unilever Plc in 2021 was US$ 9,125 Mn
- At a 17.98% increase from, Unilever Plc’s operating income of US$ 11,505 Mn was indexed in 2020
- Unilever Plc generated an operating income of US$ 9,752 Mn in 2019
Net Income(US$ Mn)
- Unilever Plc’s net income for 2021 was US$ 6,713 Mn, a -2.07% decrease from 2020
- From 2019’s net incomes, Unilever Plc registered an 8.83% increase in 2020, amounting to US$ 6,855 Mn
- A net income of US$ 6,299 Mn was generated in 2019 by Unilever Plc.
Operating Margin %
- The operating margin generated by Unilever Plc in 2021 was 18%
- At a 10.12% increase from, Unilever Plc’s operating margin of 19% was indexed in 2020
- Unilever Plc generated an operating margin of 17% in 2019
Gross Margin %
- The gross margin generated by Unilever Plc in 2021 was 12%
- At an 18.52% increase from, Unilever Plc’s gross margin of 13% was indexed in 2020
- Unilever Plc generated a gross margin of 11% in 2019
SWOT Analysis
Strengths
Operational capabilities
Unilever’s extensive network helps it to gain operational synergy and serves its customers efficiently. The company’s strong operational capabilities allow it to expand its business opportunities and plan for expansion. It also ensures a steady supply of inputs, manages its supply risks and price fluctuations, and simplifies the process. It manages global networks of around 450 logistics warehouses, offices, 290 manufacturing plants, and 290 offices.
The company has approximately 100 locations and serves around 25 million outlets worldwide. To market its products in India, the company expanded the Shikhar eB2B platform. Unilever is present in three regions: Asia/AMET/RUB, the Americas, Europe, and the Middle East. The Asia/AMET/RUB area accounted for 46.2% of the company’s revenue in FY2020. Europe was at 31.7% and 22.1 I>
Get this premium content


