Global Mass Spectrometry Imaging Market By Product Type (Maldi, Esi, Others), By Application (Proteomics, Clinical, Metabolomics, Others), By Region and Key Companies - Industry Segment Outlook, Market Assessment, Competition Scenario, Trends and Forecast 2019-2028
- Published date: Apr 2022
- Report ID: 30688
- Number of Pages: 245
- Format:
- keyboard_arrow_up
Market.us announces the publication of its most recently generated research report titled, “Global Mass Spectrometry Imaging Market by Product Type (MALDI, ESI, Others), By Application (Proteomics, Clinical, Metabolomics, Others), and by Region – Global Forecast to 2028.”, Which offers a holistic view of the global mass spectrometry imaging market through systematic segmentation that covers every aspect of the target market.
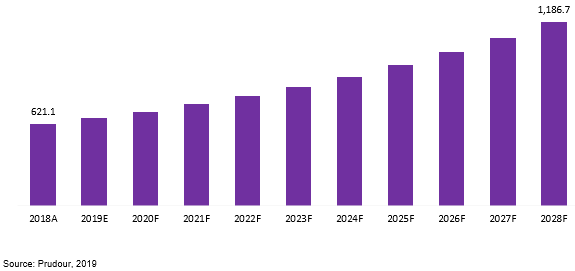
The Global Mass Spectrometry Imaging Market is projected to be US$ 621.1 Mn in 2018 to reach US$ 1,186.7 Mn by 2028 at a CAGR of 6.7%.
Mass spectrometry imaging (MSI) is an imaging technique that facilitates untargeted investigations of the spatial distribution of molecular species in a variety of samples. It has the feature to image thousands of biological molecules in a single experiment without labeling. The information gathered from mass spectrometry (MS), and visualization of spatial distributions in sample sections makes this a valuable tool useful for biological specimen characterization.
The mass spectrometer ionizes the molecules on the surface of the sample and gathers a mass spectrum at each pixel on the section, with the resulting spatial resolution defined by the pixel size. After assembling the spectra, computer software can be used to select an individual mass-to-charge (m/z) value and the intensity of the m/z is extracted from each pixel’s spectrum. Then these intensities are combined into a heat map image representing the relative distribution of that m/z value throughout the sample’s surface. To determine the identity of a specific m/z value, Tandem MS fragmentation can be done onions from each pixel, and the fragments can be used to assemble the structure of the unknown molecule.
trending_up Total Revenue in 2018$ 621.1 Mn
trending_up Market CAGR of the Next Ten Years6.7%
no_encryption Market Value (US$ Mn), Share (%) and Growth Rate (%) Comparison 2012-2028Purchase this report or a membership to unlock the market value (US$ Mn), share (%) and growth rate (%) comparison for this industry.- By Type
- By Region
- By Application
no_encryption Leading Companies Financial HighlightsPurchase this report or a membership to unlock the leading companies financial highlights for this industry.trending_up Market Revenue of the Next Ten Years$ 1,186.7 Mn
Safety Regulations-Strict safety regulations are expected to drive the acceptance of mass spectrometry in the pharmaceuticals, biotechnology, and food & beverages testing companies, which is one of the major factors expected to drive the growth of the market.
However, the high cost of mass spectrometry imaging instruments has not only constrained the entry of new and small companies into the market but has also obstructed leading players from undertaking large-scale research and development activities, which is expected to challenge the market growth to a certain extent Nonetheless, developing economies in the Asia Pacific such as China, India, etc. are a relatively untapped market, that provides lucrative opportunities for major players to increase penetration in these markets to augment their market share.
Global Mass Spectrometry Imaging Market Revenue (US$ Mn), 2018–2028

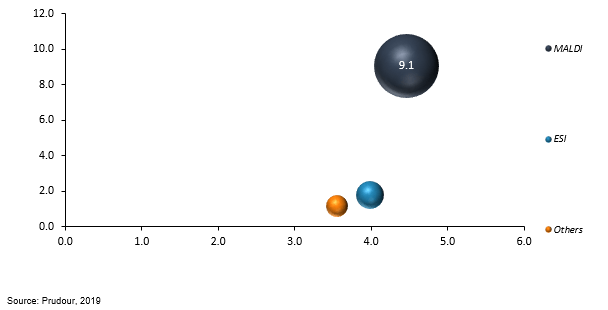
The global mass spectrometry imaging market is segmented based on product type, application, and region. On the basis of product type, the market is segmented into MALDI, ESI, and Others. The MALDI segment accounts for the majority share and is expected to register the highest growth over the forecast period, followed by the ESI segment. On the basis of application, the market is segmented into proteomics, clinical, metabolomics, and others. The clinical segment accounts for a majority share in the global mass spectrometry imaging market.
Global Mass Spectrometry Imaging Market by Formulation, 2018

On the basis of region, the market is segmented into North America, Europe, APAC, South America, and Middle East Africa. North America accounts for the majority share in the global mass spectrometry imaging market, owing to increasing spending on pharmaceuticals R&D. APAC is expected to register the highest growth rate over the forecast period. Regions such as Europe, South America, and MEA are expected to register stable growth over the forecast period.
The research report on the global mass spectrometry imaging market includes profiles of some of the major companies such as Thermo Fisher Scientific Inc., Danaher Corporation, Waters Corporation, Bruker Corporation, Shimadzu Corporation, and JEOL Ltd. and Analytik Jena AG.
Key Market Segments
Type
- MALDI
- ESI
- Others
Application
- Proteomics
- Clinical
- Metabolomics
Key Market Players included in the report:
- Thermo Fisher Scientific Inc.
- Danaher Corporation
- Waters Corporation
- Bruker Corporation
- Shimadzu Corporation
- JEOL Ltd.
- Analytik Jena AG
For the Mass Spectrometry Imaging Market research study, the following years have been considered to estimate the market size:
Attribute Report Details Historical Years
2016-2020
Base Year
2021
Estimated Year
2022
Short Term Projection Year
2028
Projected Year
2023
Long Term Projection Year
2032
Report Coverage
Competitive Landscape, Revenue analysis, Company Share Analysis, Manufacturers Analysis, Volume by Manufacturers, Key Segments, Key company analysis, Market Trends, Distribution Channel, Market Dynamics, COVID-19 Impact Analysis, strategy for existing players to grab maximum market share, and more.
Regional Scope
North America, Europe, Asia-Pacific, South America, Middle East & Africa
Country Scope
United States, Canada and Mexico, Germany, France, UK, Russia and Italy, China, Japan, Korea, India and Southeast Asia, Brazil, Argentina, Colombia etc.Saudi Arabia, UAE, Egypt, Nigeria and South Africa
 Mass Spectrometry Imaging MarketPublished date: Apr 2022add_shopping_cartBuy Now get_appDownload Sample
 - Thermo Fisher Scientific Company Profile
- Danaher Corporation Company Profile
- Waters Corporation
- Bruker Corporation
- Shimadzu Corporation
- JEOL Ltd.
- Analytik Jena AG
- settingsSettings
Our Clients

- 30688
- Apr 2022
-
US $5,999US $2,999
-
US $7,999US $3,499
-
US $12,999US $4,499
|
Single User
$5,999
$2,999
USD / per unit
save 50% |
Multi User
$7,999
$3,499
USD / per unit
save 55% |
Corporate User
$12,999
$4,499
USD / per unit
save 65% | |
|---|---|---|---|
| e-Access | |||
| Data Set (Excel) | |||
| Company Profile Library Access | |||
| Interactive Dashboard | |||
| Free Custumization | No | up to 10 hrs work | up to 30 hrs work |
| Accessibility | 1 User | 2-5 User | Unlimited |
| Analyst Support | up to 20 hrs | up to 40 hrs | up to 50 hrs |
| Benefit | Up to 20% off on next purchase | Up to 25% off on next purchase | Up to 30% off on next purchase |
| Buy Now ($ 2,999) | Buy Now ($ 3,499) | Buy Now ($ 4,499) |


